Traditionally, Cisco has leveraged BFD to monitor tunnels and their performance and Application Aware Routing (AAR) to reroute traffic. BFD has been used to measure:
- Latency.
- Loss.
- Jitter.
Additionally, BFD is also used to verify liveliness of the tunnels. This works well, but there are some drawbacks to using a separate protocol for measuring performance:
- You are adding control plane packets competing for bandwidth with packets in data plane.
- Sending control plane packets frequently may overload the control plane.
- This may lead to false positives.
- It’s not guaranteed that control plane packets and data plane packets are treated equally.
- AAR did take some time to react to poor transports as it had to collect enough measurements before reacting.
- AAR didn’t have a built-in dampening mechanism.
With the default BFD settings, BFD packets are sent every second. The default AAR configuration consists of six buckets that hold 10 minutes of data each. This means that with the default settings, AAR will react in 10-60 minutes depending on how poorly the transport is performing. The most aggressive AAR configuration recommended by Cisco was to have 5 buckets holding 2 minutes of data each. AAR would then react in 2-10 minutes which I would consider to be in the acceptable range.
What would be the alternative to this approach? This is where Enhanced AAR (EAAR) comes into play as of 20.12. It uses inline data, that is, the packets that are already sent in the data plane to measure the performance. This allows for faster rerouting as there is more data to collect than when relying on the control plane for measurement. EAAR also has a dampening mechanism to prevent “flapping” between transports. EEAR has the following characteristics:
- Supports both GRE and IPSec.
- Supports all interfaces types and TLOCs including physical, subinterface, dialer, LTE, and loopback bind mode.
- It also supports TLOC extension.
- It supports both IPv4 and IPv6 in the underlay.
- The minimum interval to update SLA and switch to another transport is 10 seconds.
- It does not impact tunnel scale, but has minimal impact on memory and performance.
- It support both probing with different classes or using a single class.
- It supports SLA dampening.
Now, what happens if you have devices in your network that doesn’t support EAAR? A device can run both AAR and EAAR. If the other device is capable, they will run EAAR, if not, the device will fall back to AAR. Also note that EAAR is not enabled by default so unless enabling it, the device will run AAR.
Before enabling EAAR, let’s take a look at the options we have to configure it and the timers involved. EAAR can be configured in three different ways:
- Configuration groups (the “replacement” for templates).
- Templates.
- CLI.
When using configuration groups and templates, there are three modes you can run, conservative, moderate, and aggressive. Only via CLI mode is it possible to change the timers. The three modes are shown below:
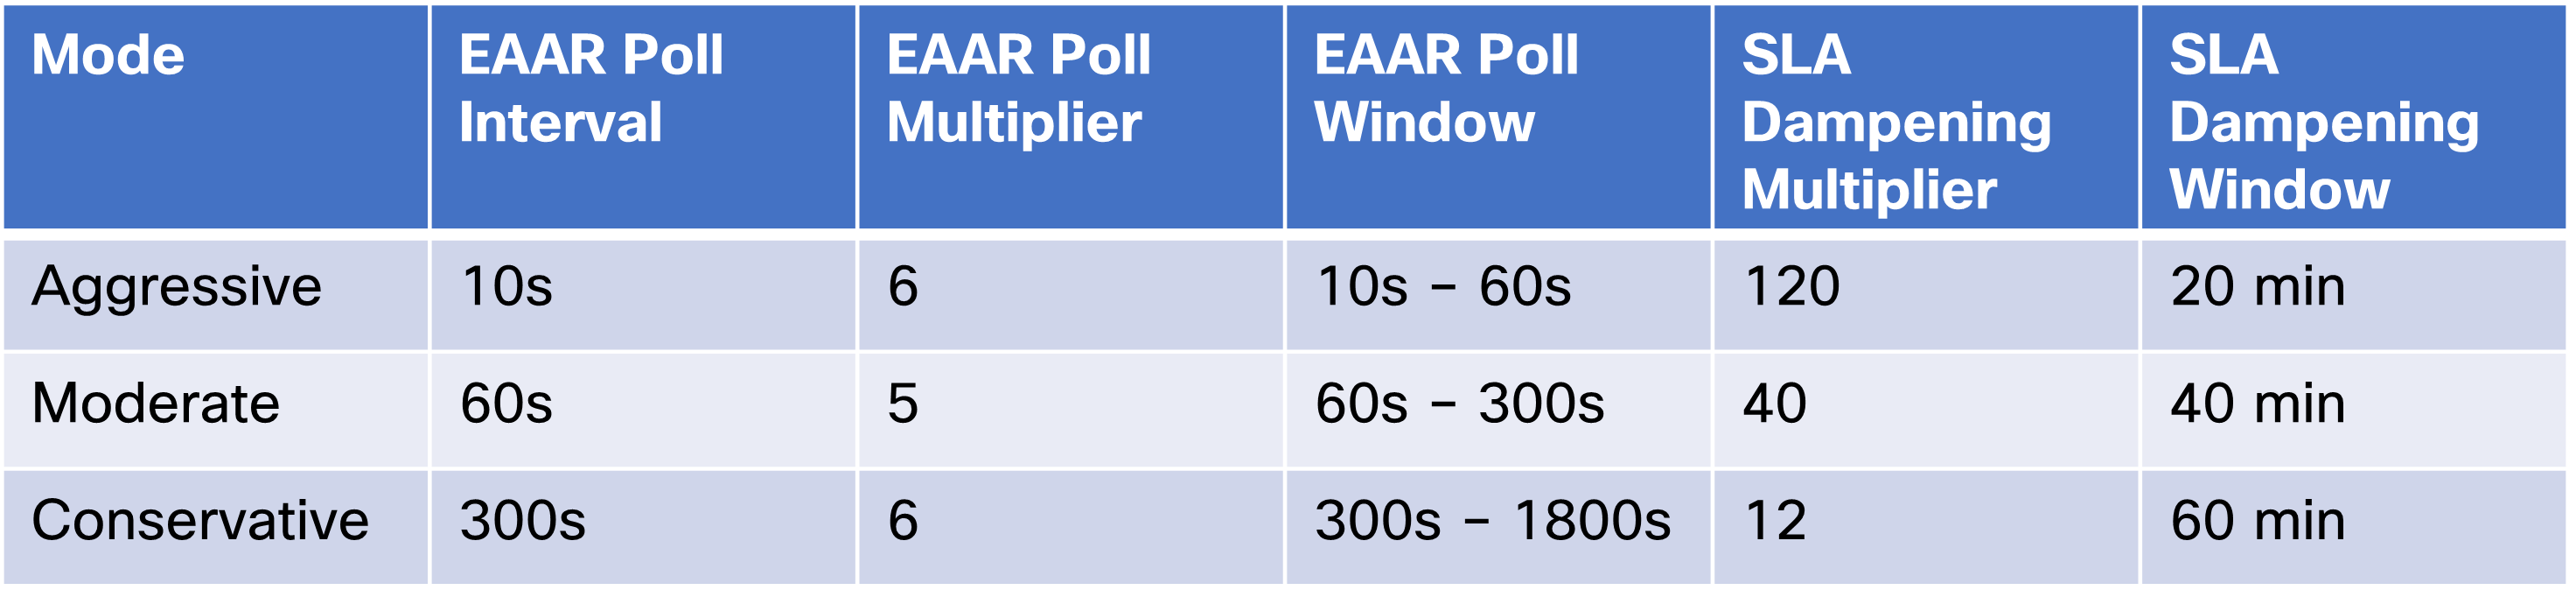
Using for example aggressive mode, EAAR will react within 10-60 seconds. What is the SLA dampening multiplier and dampening window? The SLA dampening multiplier is a value that is multiplied with the EAAR poll interval to get the SLA dampening window. For example, for aggressive mode this is 120 x 10s = 1200s = 20 minutes. This means that a tunnel must meet the SLA for 20 minutes before it will take any traffic again. To describe more in detail how this works, look at the graph below:
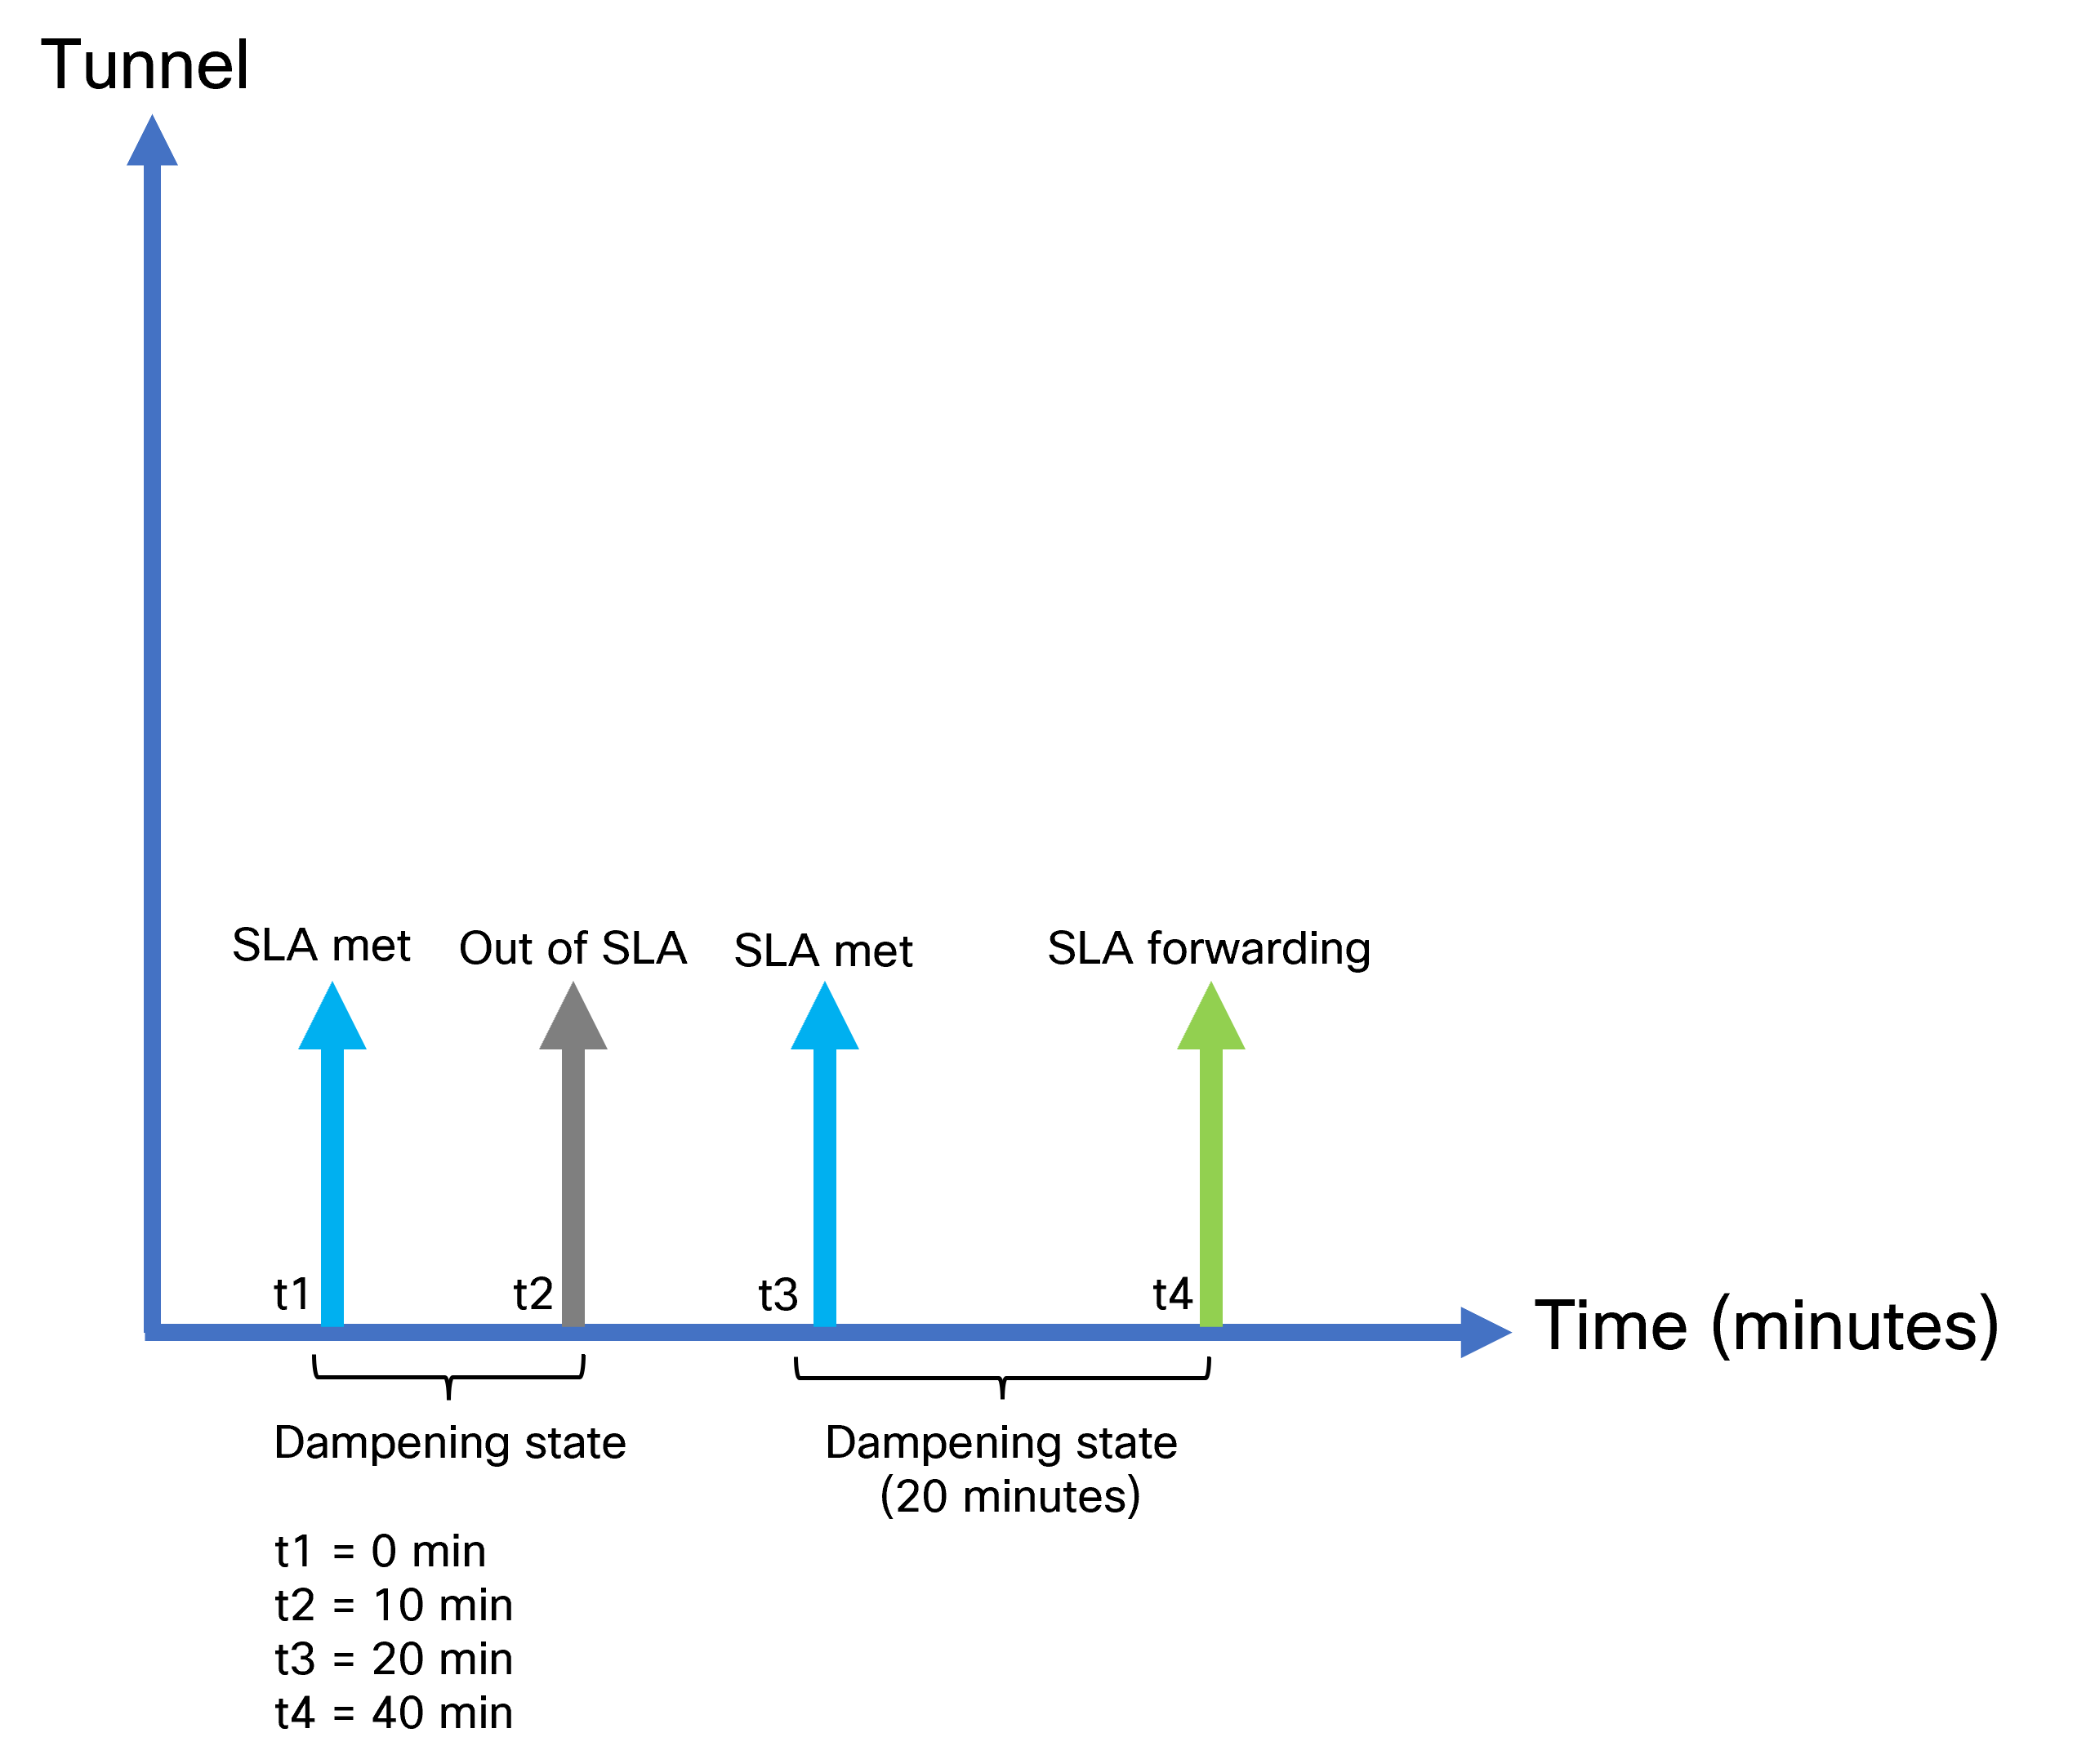
At t1, the tunnel starts meeting the SLA. This starts a timer where the tunnel is in a dampening state. However, after 10 minutes the tunnel goes out of SLA and the timer is canceled. The tunnel did not meet the SLA long enough to move into a forwarding state. After another 10 minutes, the tunnel starts meeting the SLA. This time the tunnel meets the SLA for 20 minutes so it can move to the SLA forwarding state. If the tunnel were to go out of SLA again, it would take 20 minutes before it goes to forwarding.
I mentioned before that EAAR uses inline data, but how does this really work? Let’s take a closer look. As inline data is used, this means that we must add data to our packets. This is called metadata. This will require an additional 12 bytes in every packet which is a consideration when it comes to MTU and bandwidth. The tunnel will automatically adjust its MTU though without any user configuration required. It’s important to note that packet loss and jitter is measured unidirectionally while the latency is measured roundtrip. How are the measurements reported? Through the use of BFD!
It’s also important to note that for latency and jitter, sampling is used where packets are sampled every 100 ms. For packet loss, all packets are taken into consideration. The measurement of packet loss has the following characteristics:
- When using IPSec as encapsulation, measurement can be done per queue (QoS classes).
- Leveraging sequence numbers in IPSec.
- When using GRE as encapsulation, there is single measurement and not per queue.
- Meta data header will include sequence number.
- The device separates local loss from WAN loss.
- Local loss is the number of packets sent compared to total number of packets (per queue).
- WAN loss is the number of packets received compared to the number of sent.
- Receiver reports WAN loss to sender through Path-Mon TLV in BFD.
- If no inline data is being sent, then measurement is done via BFD.
When it comes to measuring latency, timestamps are carried in the metadata to be able to do the calculation. The jitter can also be calculated based on this timestamp.
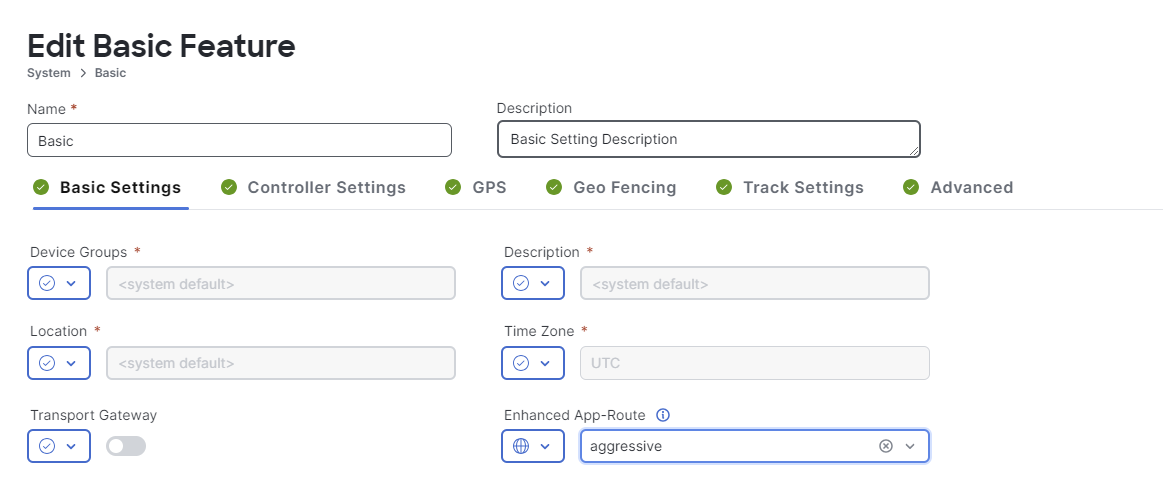
Now let’s configure EAAR using configuration groups.This is done by going to Configuration -> Configuration Groups. Then clicking Edit. Expand System Profile and click Edit Feature next to the basic parcel.
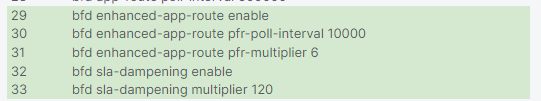
The following CLI commands will be added when deploying the edited configuration group:
Then let’s verify that EAAR has been enabled:
R1-SITE1#show sdwan app-route params
Enhanced Application-Aware routing
    Config:                  :Enabled
    Poll interval:           :10000
    Poll multiplier:         :6

App route
    Poll interval:           :600000
    Poll multiplier:         :6

SLA dampening
    Config:                  :Enabled
    Multiplier:              :120
Initially, there is no data as this is my lab and there is no inline traffic between the sites:
R2-SITE1#show sdwan app-route stats sum
Generating output, this might take time, please wait ...
app-route statistics 10.0.2.2 10.0.3.2 gre 0 0
 remote-system-ip         192.168.1.3
 local-color              gold
 remote-color             gold
 sla-class-index          0,1
 fallback-sla-class-index None
 enhanced-app-route       Enabled
 sla-dampening-index      None
 app-probe-class-list None
  mean-loss    0.000
  mean-latency 0
  mean-jitter  0
       TOTAL                       AVERAGE  AVERAGE  TX DATA       RX DATA       IPV6 TX       IPV6 RX
INDEX  PACKETS       LOSS          LATENCY  JITTER   PKTS          PKTS          DATA PKTS     DATA PKTS
-------------------------------------------------------------------------------------------------------------
0      0             0             0        0        0             0             0             0
1      0             0             0        0        0             0             0             0
2      0             0             0        0        0             0             0             0
3      0             0             0        0        0             0             0             0
4      0             0             0        0        0             0             0             0
5      0             0             0        0        0             0             0             0
I then generate some traffic with iPerf and we can see that the measurement is working:
R1-SITE1#show sdwan app-route stats sum
Generating output, this might take time, please wait ...
app-route statistics 10.0.1.2 10.0.3.2 gre 0 0
 remote-system-ip         192.168.1.3
 local-color              gold
 remote-color             gold
 sla-class-index          0,1
 fallback-sla-class-index None
 enhanced-app-route       Enabled
 sla-dampening-index      None
 app-probe-class-list None
  mean-loss    0.000
  mean-latency 30
  mean-jitter  0
       TOTAL                       AVERAGE  AVERAGE  TX DATA       RX DATA       IPV6 TX       IPV6 RX
INDEX  PACKETS       LOSS          LATENCY  JITTER   PKTS          PKTS          DATA PKTS     DATA PKTS
-------------------------------------------------------------------------------------------------------------
0      0             0             30       0        0             961           0             0
1      0             0             30       0        0             961           0             0
2      0             0             30       0        0             961           0             0
3      0             0             30       0        0             961           0             0
4      0             0             30       0        0             961           0             0
5      0             0             30       0        0             961           0             0
The latency is currently around 30ms and gold is our preferred path between the two sites:
R1-SITE1#show sdwan policy service-path vpn 10 interface GigabitEthernet5 source-ip 10.0.101.10 dest-ip 10.0.102.10 protocol 17 all
Number of possible next hops: 2
Next Hop: GRE
  Source: 10.0.1.2 Destination: 10.0.3.2 Local Color: gold Remote Color: gold Remote System IP: 192.168.1.3
Next Hop: GRE
  Source: 10.0.1.2 Destination: 10.0.4.2 Local Color: gold Remote Color: gold Remote System IP: 192.168.1.4
Now let’s introduce some more latency. I have set the SLA class to a maximum of 100ms of latency so let’s see how it reacts when the latency is slightly worse (110 ms). Take a look at the ping below:
64 bytes from 10.0.102.10: icmp_seq=346 ttl=62 time=30.9 ms
64 bytes from 10.0.102.10: icmp_seq=347 ttl=62 time=111 ms
64 bytes from 10.0.102.10: icmp_seq=348 ttl=62 time=111 ms
<SNIP>
64 bytes from 10.0.102.10: icmp_seq=403 ttl=62 time=111 ms
64 bytes from 10.0.102.10: icmp_seq=404 ttl=62 time=111 ms
64 bytes from 10.0.102.10: icmp_seq=405 ttl=62 time=0.935 ms
The latency was around 30 ms before adding the extra delay. The delay was then around 110 ms for a little less than a minute before moving to an alternate path that has no added latency. The app route stats show the increase in latency:
R1-SITE1#show sdwan app-route stats sum
Generating output, this might take time, please wait ...
app-route statistics 10.0.1.2 10.0.3.2 gre 0 0
 remote-system-ip         192.168.1.3
 local-color              gold
 remote-color             gold
 sla-class-index          0
 fallback-sla-class-index 1
 enhanced-app-route       Enabled
 sla-dampening-index      None
 app-probe-class-list None
  mean-loss    0.000
  mean-latency 110
  mean-jitter  0
       TOTAL                       AVERAGE  AVERAGE  TX DATA       RX DATA       IPV6 TX       IPV6 RX
INDEX  PACKETS       LOSS          LATENCY  JITTER   PKTS          PKTS          DATA PKTS     DATA PKTS
-------------------------------------------------------------------------------------------------------------
0      0             0             110      0        10            961           0             0
1      0             0             110      0        10            961           0             0
2      0             0             110      0        10            961           0             0
3      0             0             110      0        10            961           0             0
4      0             0             110      0        10            961           0             0
5      0             0             110      0        10            961           0             0
The preferred path is now silver:
R1-SITE1#show sdwan policy service-path vpn 10 interface GigabitEthernet5 source-ip 10.0.101.10 dest-ip 10.0.102.10 protocol 17 all
Number of possible next hops: 1
Next Hop: GRE
  Source: 10.0.11.2 Destination: 10.0.13.2 Local Color: silver Remote Color: silver Remote System IP: 192.168.1.3
We can also see that once gold is meeting the SLA again, it is being dampened:
R1-SITE1#show sdwan app-route stats sum
Generating output, this might take time, please wait ...
app-route statistics 10.0.1.2 10.0.3.2 gre 0 0
 remote-system-ip         192.168.1.3
 local-color              gold
 remote-color             gold
 sla-class-index          0
 fallback-sla-class-index 1
 enhanced-app-route       Enabled
 sla-dampening-index      1
 app-probe-class-list None
  mean-loss    0.000
  mean-latency 0
  mean-jitter  0
       TOTAL                       AVERAGE  AVERAGE  TX DATA       RX DATA       IPV6 TX       IPV6 RX
INDEX  PACKETS       LOSS          LATENCY  JITTER   PKTS          PKTS          DATA PKTS     DATA PKTS
-------------------------------------------------------------------------------------------------------------
0      0             0             0        0        0             0             0             0
1      0             0             0        0        0             0             0             0
2      0             0             0        0        0             0             0             0
3      0             0             0        0        0             0             0             0
4      0             0             0        0        0             0             0             0
5      0             0             0        0        0             0             0             0
This is indicated by the sla-dampening-index being set to 1. Now what would happen if we induce a lot more latency to our transports? Would EAAR react faster? Let’s try! We’ll add 300 ms of latency now. The ping is below:
64 bytes from 10.0.102.10: icmp_seq=1 ttl=62 time=301 ms
64 bytes from 10.0.102.10: icmp_seq=2 ttl=62 time=301 ms
64 bytes from 10.0.102.10: icmp_seq=3 ttl=62 time=301 ms
64 bytes from 10.0.102.10: icmp_seq=4 ttl=62 time=301 ms
64 bytes from 10.0.102.10: icmp_seq=5 ttl=62 time=301 ms
64 bytes from 10.0.102.10: icmp_seq=6 ttl=62 time=301 ms
64 bytes from 10.0.102.10: icmp_seq=7 ttl=62 time=301 ms
64 bytes from 10.0.102.10: icmp_seq=8 ttl=62 time=301 ms
64 bytes from 10.0.102.10: icmp_seq=9 ttl=62 time=301 ms
64 bytes from 10.0.102.10: icmp_seq=10 ttl=62 time=301 ms
64 bytes from 10.0.102.10: icmp_seq=11 ttl=62 time=301 ms
64 bytes from 10.0.102.10: icmp_seq=12 ttl=62 time=301 ms
64 bytes from 10.0.102.10: icmp_seq=13 ttl=62 time=301 ms
64 bytes from 10.0.102.10: icmp_seq=14 ttl=62 time=301 ms
64 bytes from 10.0.102.10: icmp_seq=15 ttl=62 time=301 ms
64 bytes from 10.0.102.10: icmp_seq=16 ttl=62 time=0.953 ms
The reaction was much faster! Only around 15 seconds as the delay was much more severe now. We can see that bronze is the preferred path now:
R1-SITE1#show sdwan policy service-path vpn 10 interface GigabitEthernet5 source-ip 10.0.101.10 dest-ip 10.0.102.10 protocol 17 all
Number of possible next hops: 1
Next Hop: GRE
  Source: 10.0.21.2 Destination: 10.0.23.2 Local Color: bronze Remote Color: bronze Remote System IP: 192.168.1.3
Currently both gold and silver are being dampened:
R1-SITE1#show sdwan app-route stats sum
Generating output, this might take time, please wait ...
app-route statistics 10.0.1.2 10.0.3.2 gre 0 0
 remote-system-ip         192.168.1.3
 local-color              gold
 remote-color             gold
 sla-class-index          0
 fallback-sla-class-index 1
 enhanced-app-route       Enabled
 sla-dampening-index      1
 app-probe-class-list None
  mean-loss    0.000
  mean-latency 0
  mean-jitter  0
       TOTAL                       AVERAGE  AVERAGE  TX DATA       RX DATA       IPV6 TX       IPV6 RX
INDEX  PACKETS       LOSS          LATENCY  JITTER   PKTS          PKTS          DATA PKTS     DATA PKTS
-------------------------------------------------------------------------------------------------------------
0      0             0             0        0        0             0             0             0
1      0             0             0        0        0             0             0             0
2      0             0             0        0        0             0             0             0
3      0             0             0        0        0             0             0             0
4      0             0             0        0        0             0             0             0
5      0             0             0        0        0             0             0             0

app-route statistics 10.0.11.2 10.0.13.2 gre 0 0
 remote-system-ip         192.168.1.3
 local-color              silver
 remote-color             silver
 sla-class-index          0
 fallback-sla-class-index 1
 enhanced-app-route       Enabled
 sla-dampening-index      1
 app-probe-class-list None
  mean-loss    0.000
  mean-latency 0
  mean-jitter  0
       TOTAL                       AVERAGE  AVERAGE  TX DATA       RX DATA       IPV6 TX       IPV6 RX
INDEX  PACKETS       LOSS          LATENCY  JITTER   PKTS          PKTS          DATA PKTS     DATA PKTS
-------------------------------------------------------------------------------------------------------------
0      0             0             0        0        0             0             0             0
1      0             0             0        0        0             0             0             0
2      0             0             0        0        0             0             0             0
3      0             0             0        0        0             0             0             0
4      0             0             0        0        0             0             0             0
5      0             0             0        0        0             0             0             0
Once gold is out of dampening, it is yet again preferred:
show sdwan policy service-path vpn 10 interface GigabitEthernet5 source-ip 10.0.101.10 dest-ip 10.0.102.10 protocol 17 all
Number of possible next hops: 2
Next Hop: GRE
  Source: 10.0.1.2 Destination: 10.0.3.2 Local Color: gold Remote Color: gold Remote System IP: 192.168.1.3
Next Hop: GRE
  Source: 10.0.1.2 Destination: 10.0.4.2 Local Color: gold Remote Color: gold Remote System IP: 192.168.1.4
That wraps up our deep dive into EAAR. We learned that it uses inline data as opposed to BFD to monitor tunnels but that the results are reported via BFD. With the use of EAAR, faster convergence times can be achieved and tunnels be dampened if they are flapping. I hope this has been informative and see you in the next post.
Great post, thanks.
Did you maybe use AAR in combination with Custom Applications?
Does AAR work as expected? What is your experience?
Thanks in advance.
Thanks!
I try to avoid complexity in AAR configuration. Generally I have a class that matches all traffic. You don’t want to have even less important apps behave badly. Then if you have some important apps you would classify them using for example DSCP or prefixes. It’s good if you can tag the packets from the application itself or as close to the app as possible.
I haven’t done much with custom apps yet.